
KHIZHNYAKOV

← All templates

Department Indicator Monitoring in Excel: Plan vs Actual, Ranking, Traffic Light

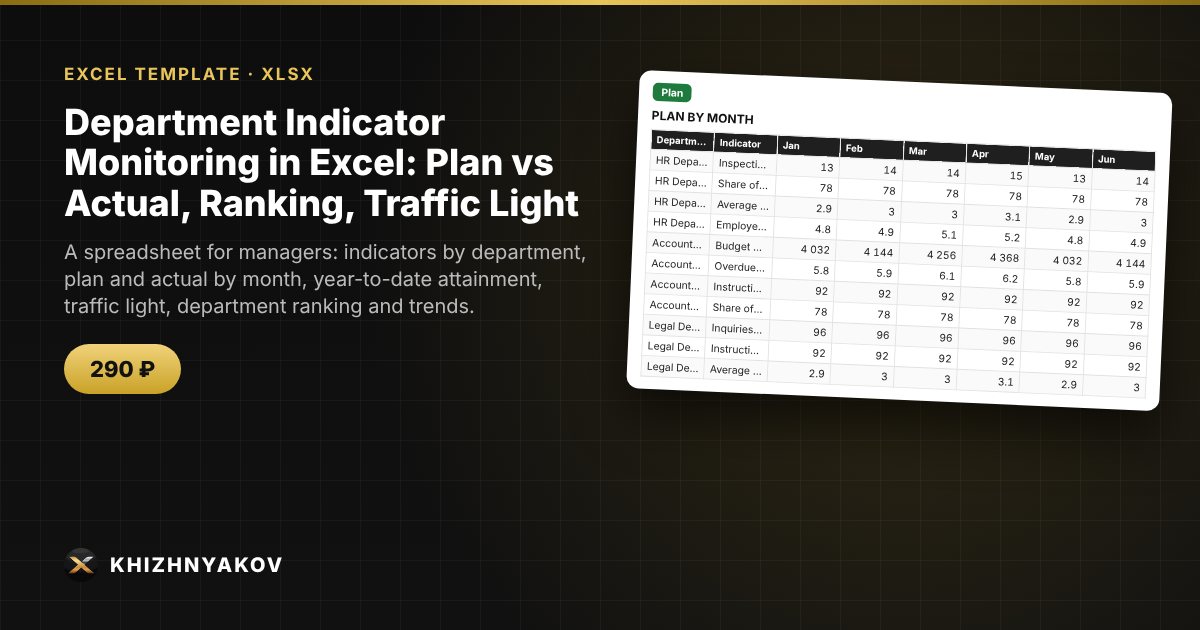
A spreadsheet for managers: indicators by department, plan and actual by month, year-to-date attainment, traffic light, department ranking and trends.

Department Indicator Monitoring in Excel: Plan vs Actual, Ranking, Traffic Light
≈ $3.59
290 ₽
Blank template + filled-in example · Excel 2007+, LibreOffice, Google Sheets
Payment is processed securely by YooKassa in Russian rubles. If your card is declined, email us at info@хижняков.рф and we will arrange another way to pay.

What it is for

When an organization has several departments and dozens of indicators, the figures sit in different files, and at a meeting the manager does not see the big picture. Here plan and actual are entered by month, and the spreadsheet calculates attainment, colors the traffic light, builds a department ranking and shows whose trend is rising and whose is falling.

What's inside

  • "Lists": year, reporting month, traffic-light thresholds, departments (up to 12) and indicators (up to 20) with unit, direction, accumulation and weight.
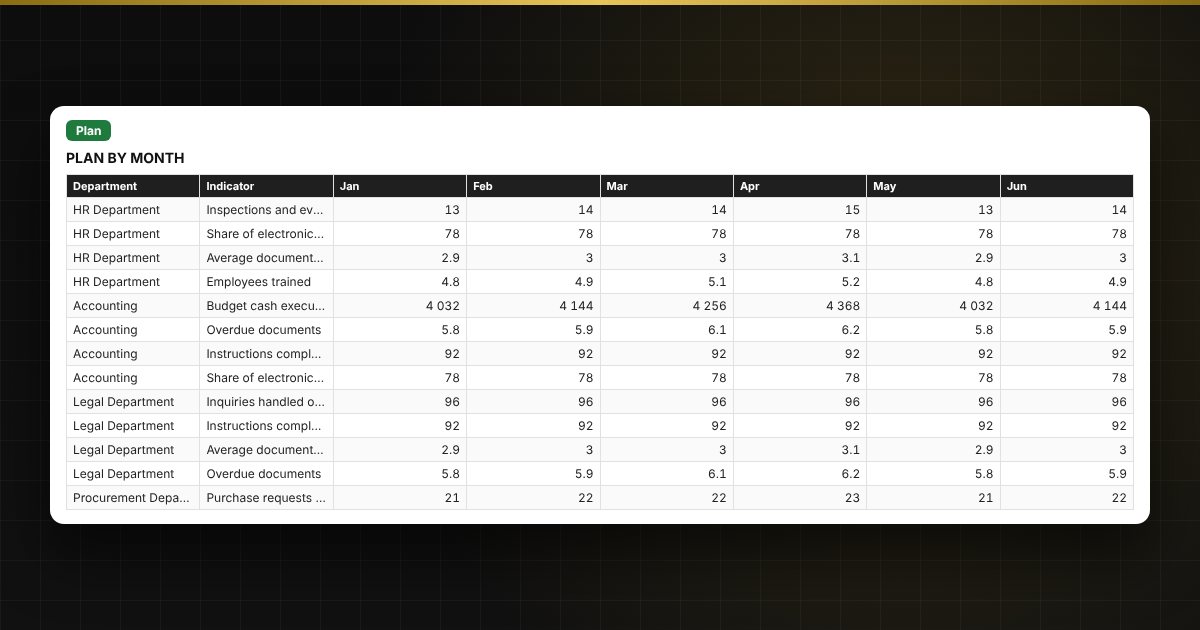
  • "Plan" and "Actual": up to 200 "department — indicator" rows with months from January to December; in "Actual" the names are filled in automatically.
  • "Calculation": year-to-date attainment, traffic light, change versus the previous month and attainment for each month.
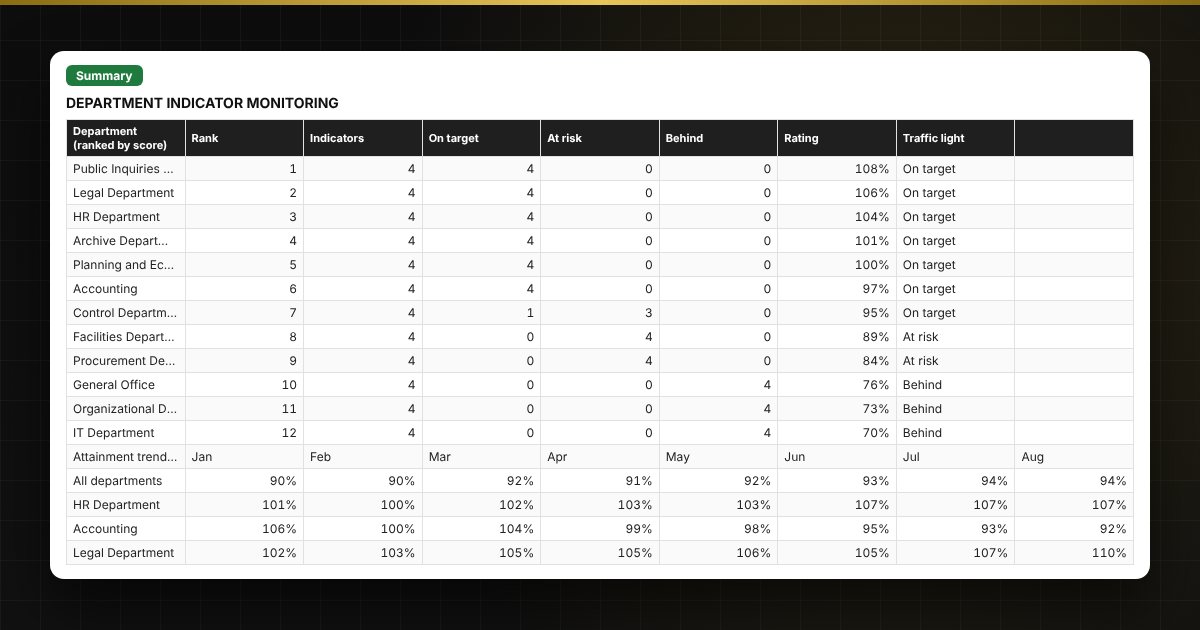
  • "Summary": department ranking, number of indicators in the green, yellow and red zones, a monthly trend table and two charts.

Who it is for

Heads of departments and organizations, control and reporting specialists, and unit managers in business who need a clear overview of indicators without complex systems.

Compatibility

Excel 2007 and later, LibreOffice. No macros. The file is in English. Thresholds and standard values are placed in the settings: check them against your own rules before use. The calculation is approximate.

📘 How to Monitor Department KPIs in Excel: Plan vs Actual, Traffic Light, Ranking

Questions and answers

How is indicator attainment calculated?
For "higher is better" indicators it is actual divided by plan; for "lower is better" ones (overdue items, complaints, turnaround times) it is plan divided by actual. The result is capped by the "Maximum credited" setting, 150% by default.
How is the total for the year or period calculated?
Year-to-date from January to the reporting month, which you choose on the "Lists" sheet. For sums the months are added up; for percentages and average times the average is taken.
Can I adjust the traffic-light thresholds and weights?
Yes. The "On target" and "At risk" thresholds and the importance weight of each indicator from 1 to 5 are set in the lists. These are your internal benchmarks; check them against your organization's current plans and orders.
How many departments and indicators does the spreadsheet hold?
Up to 12 departments, up to 20 indicators and up to 200 "department — indicator" rows. No macros; it works in Excel 2007 and later and in LibreOffice.